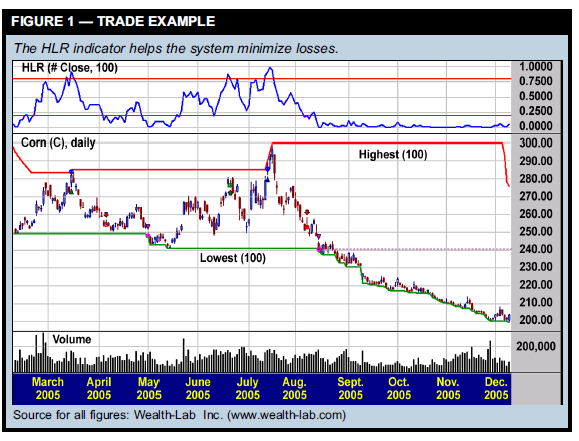
Many trend-following systems generate trade signals when price hits the boundaries of a breakout channel, going long when price hits a new n-bar high or going short when it drops to a new n-day low, in the hope the trend will continue. However, such systems usually trigger many whipsaw trades when the price fails to follow through in the expected direction. This system tries to reduce whipsaw losses with the HighestLowest-Range (HLR) indicator, which shows price’s relative location within the high-low range of the past n bars. If price is at the bottom of the range, the indicator’s value is zero; if price is at the top of this range, its value is 1; and if price is exactly between these boundaries, the HLR indicator is 0.5. The HLR system initially enters the market using standard breakout rules, but it exits a losing trade if price comes within 20 percent of the channel boundaries. Figure 1 shows an example in corn futures (C). The upper pane shows the HLR indicator and its threshold values of 0.80 and 0.20 (the upper and lower 20 percent of the indicator’s range; red lines). The chart contains multiple whipsaw trades. The system entered long on March 15, 2005 after price hit a new 100-day high, but the market soon reversed and turned down toward the 100-day breakout channel’s lower boundary. The system exited when the HLR indicator dropped below 0.2 on April 5 — a 29.5-point loss. However, had the system stayed in this trade, it would have exited on May 2 and lost an additional 6 points. Another whipsaw trade occurred when the system sold short on May 2 and exited on June 21 after the HLR jumped above 0.8. Price continued higher and hit a new 100-day high on July 14. In this case, the system would have lost an additional 9 points had it held the trade until the standard exit point. In the final trade, the system went long on July 14 and exited on Aug. 8 with a loss of 32.5 points, avoiding a further loss of 12.5 points.
Defining the strategy To find out whether the HLR indicator can improve performance, it was applied to a basic breakout strategy and tested on a broad futures portfolio. The trade rules for the system are: 1. Go long tomorrow with a stop at the highest high of the past 100 days. 2. Exit long tomorrow at the market if the HLR indicator drops below 0.2 and the current position is unprofitable. 3. Go short tomorrow with a stop at the lowest low of the past 100 days. 4. Exit short tomorrow at the market if the HLR indicator climbs above 0.8 and the current position is unprofitable. The system was tested on daily price data from January 1996 to December 2005 on a portfolio of 20 futures contracts: British pound (BP), soybean oil (BO), corn (C), crude oil (CL), cotton (CT), E-Mini Nasdaq 100 (NQ), E-Mini S&P 500 (ES), 5-year T-note (FV), Eurocurrency (EC), gold (GC), Japanese yen (JY), coffee (KC), wheat (W), live cattle (LC), lean hogs (LH), natural gas (NG), sugar (SB), silver (SI), Swiss franc (SF), and 30-year T-bonds (US). The starting account equity was $1,000,000; $20 was deducted per round-trip trade per contract for commissions and two ticks of slippage were applied per trade. A maximum of three percent of account equity was allocated per trade. The number of contracts is calculated using the basis price (the closing price on the day prior to the entry), the stop-loss level, the dollar value of a one-point move in the contract, and the total account equity. For example, let’s say a contract has a point value of $250 and the system goes long at 100 (the basis price) with a stop-loss at 90. To determine the trade’s dollar risk, multiply the point value ($250) by the difference between the basis price and the stop-loss (100 – 90 = 10), which results in a singlecontract dollar risk of $2,500. If the portfolio’s total equity before entering the position was $1,000,000 and you didn’t want to risk more than three percent of the total equity ($30,000), you would buy 12 contracts.
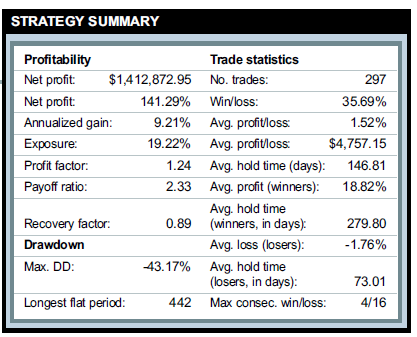
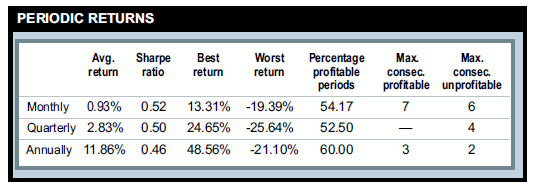
LEGEND: Net profit — Profit at end of test period, less commission • Exposure — The area of the equity curve exposed to long or short positions, as opposed to cash • Profit factor — Gross profit divided by gross loss • Payoff ratio — Average profit of winning trades divided by average loss of losing trades • Recovery factor — Net profit divided by max. drawdown • Max. DD (%) — Largest percentage decline in equity • Longest flat days — Longest period, in days, the system is between two equity highs • No. trades — Number of trades generated by the system • Win/Loss (%) — The percentage of trades that were profitable • Avg. trade — The average profit/loss for all trades • Avg. winner — The average profit for winning trades • Avg. loser — The average loss for losing trades • Avg. hold time — The average holding period for all trades • Avg. hold time (winners) — The average holding time for winning trades • Avg. hold time (losers) — The average holding time for losing trades • Max. consec. win/loss — The maximum number of consecutive winning and losing trades LEGEND: Avg. return — The average percentage for the period • Sharpe ratio — Average return divided by standard deviation of returns (annualized) • Best return — Best return for the period • Worst return — Worst return for the period • Percentage profitable periods — The percentage of periods that were profitable • Max. consec. profitable — The largest number of consecutive profitable periods • Max. consec. unprofitable — The largest number of consecutive unprofitable periods.
Strategy performance
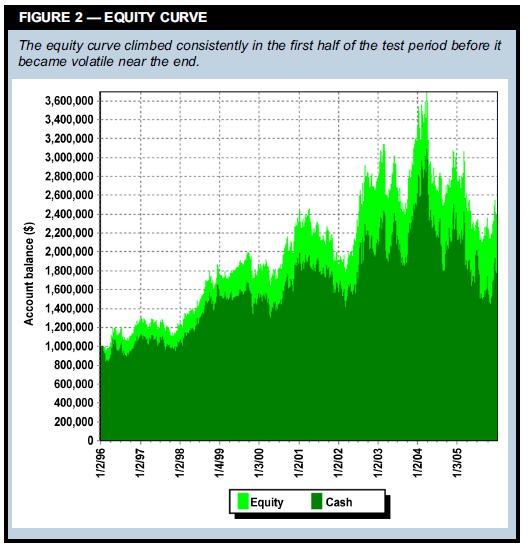
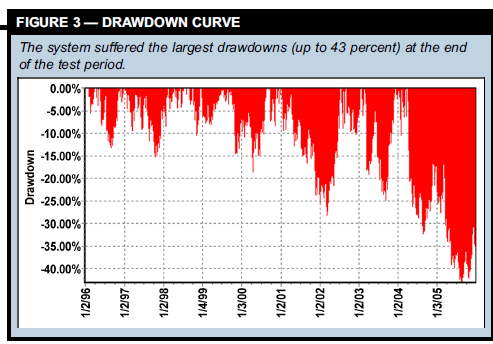
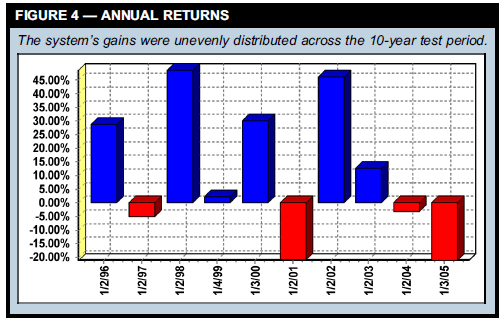
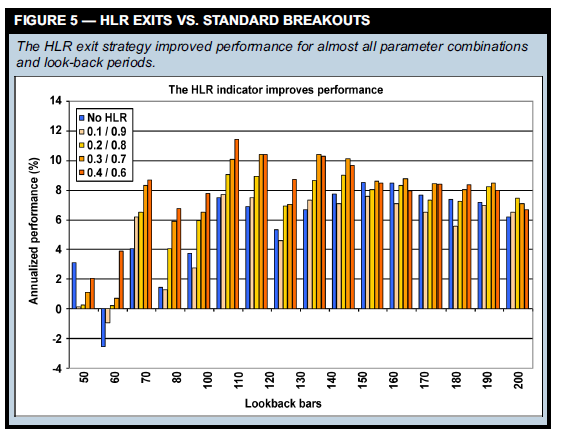
Figure 2 shows the strategy’s equity curve increased consistently in the first five years of the test period, but it became more volatile at the end of the test; Figure 3 shows the largest drawdowns (deeper than -40 percent) appeared at the end of the test period. The system resembles other trend-following systems because it makes most of its profits from a relatively low number of winning trades (35.7 percent). The average profit is 1.52 percent, so strategy should be quite resistant to higher commissions and slippage. Also, Figure 4’s yearly returns show profits were unevenly distributed. Although the system’s annualized profit was 9.21 percent, yearly returns ranged from -21 percent to +49 percent — too volatile for the average trader, but not unusual for a trend-following system. To find out if the HLR component had value, a second test was conducted on the same 100-day channel breakout strategy, without the HLR exit strategy. All other parameters and settings remained the same. This standard system had an annualized gain of 7.5 percent (vs. 9.2 percent for the HLR version) and a maximum drawdown of 50.3 percent (vs. 43.2 percent). Overall, the HLR indicator effectively cut losses, reduced volatility, and improved performance considerably. Further tests compared performance of using various HLR threshold settings and breakout channel look-back periods. The blue bar in Figure 5 represents the annualized percentage profit of the breakout system without the HLR indicator. The rest of the bars represent performance for the system with the HLR exit strategy, using long-exit thresholds from 0.1 to 0.4 and short-exit thresholds from 0.9 to 0.6. The HLR indicator provided an advantage over the traditional breakout method for nearly all parameters, with the best overall results occurring with exit thresholds of around 0.3