The S&P Witch Project” (Active Trader, December 2004) analyzed how the S&P 500 index behaved surrounding “triplewitching” expiration days — the two-day periods in March, June, September, and December when stockindex futures, stock index futures options, and equity options expire. (After single-stock futures were launched in November 2002, triple witching days were sometimes called “quadruple witching” days because these new contracts also expired on the quarterly cycle). The goal was to find out whether the market displayed any tradable patterns around these events. The article compared the S&P 500’s behavior during these quarterly expirations to its behavior during “serial” expiration months (e.g., non-quarterly months — January, February, April, May, etc.). The study uncovered a surprising distinction: The S&P 500 was actually more volatile around serial-month expirations than quarterly-cycle expirations. The index climbed more before serial-month expirations and fell more afterwards than it did in March, June, September, and December. The S&P’s behavior surrounding quarterly expirations was tame by comparison. The analysis measured the S&P 500’s average daily performance in the 16 days surrounding both types of expirations — eight days preceding expiration Friday and seven days following it, plus the expiration day itself. Figure 1 compares the market’s serial-month behavior from 1983-2004 to its performance since the original study was published (2004-2007, red and blue lines, respectively). Day -1 represents the final Thursday of each contract and Day 1 is the final Friday — the last trading day for stock options, stock-index options, and single- stock futures.
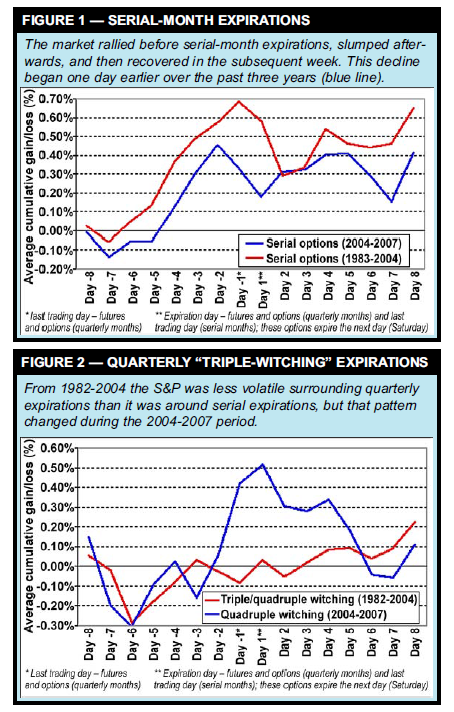
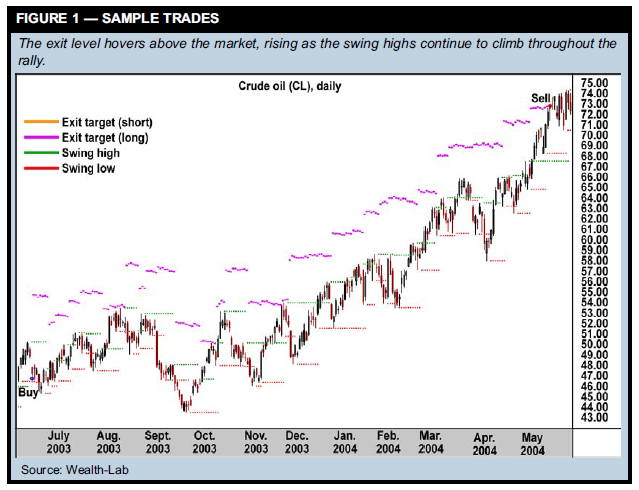
Overall, the S&P rose 0.68 percent, on average, prior to expiration Friday from 1983 to 2004. It then dropped 0.39 percent in the next two days before recovering in the subsequent week. Since 2004 the index has moved roughly in-line with this pattern, but the decline began one day earlier. The behavior around triple-witching expirations, however, has changed more notably since 2003. Figure 2 compares the S&P’s 1982-2004 average daily performance around triple-witching Fridays to its 2004-2007 performance. From 1982 to 2004 the market fell 0.29 percent leading up to quarterly expirations, but it recovered by expiration Friday. It then rallied 0.22 percent over the next seven days. From 2004-2007 by comparison, the S&P’s typical move was much bigger and more bullish at expiration — the index gained an average of 0.52 percent by expiration Friday, and although the average return declined in subsequent days through day 4, it was still much larger than the average gains during the 1982-2004 period.
Trend pullback with progressive target
Market: Futures. System concept: This system combines a pullback rule to enter existing trends with a “moving target” exit approach that closes positions when the market is still moving in the trade’s favor. Typical trend-following systems have low winning percentages and generate the majority of their profits during infrequent extended trends. A trailing stop order is often used to exit trades: As the market moves in the trade’s direction, an exit order is moved progressively closer to the current market price to lock in profits on the position. Acommon trend-following exit is the channel-based exit, which stops out (or reverses) the position when price moves below (in the case of a long trade) the n-bar low or close. One disadvantage of this type of exit is that some open profits are lost because the market must reverse to trigger the exit. Another drawback is its popularity. When the n-bar highest high/lowest low levels are crowded with a large number of stops, negative slippage is likely. Adifferent approach is placing the so-called “chandelier” stop (in the case of a long trade in an uptrend) a certain amount below the highest high or close the market has made since the position was established. As the market makes new highs, the chandelier stop moves up with it. The exit approach used here is similar to the chandelier stop except that the exit price is usually above the market (in the case of an uptrend) and is determined by the market’s current volatility, as measured by the average true range (ATR). The exit rule has two basic elements — a reference point and a reversal amount. The reference point is the level that defines the trend’s short-term turning points, or “swing highs” and “swing lows.” In this case a swing high is a price bar preceded and followed by bars with lower highs, while a swing low is a low preceded and followed by higher lows. The number of lower highs or higher lows surrounding the swing bars can vary. This approach will use two-day swings, which requires two consecutive lower highs before and after a swing high bar, and two consecutive higher lows before and after a swing low bar.
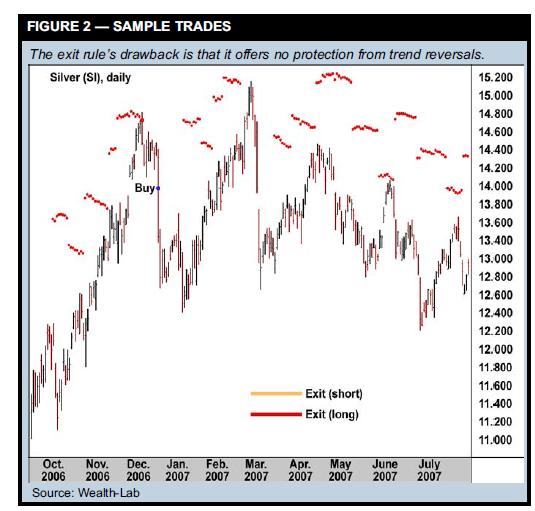
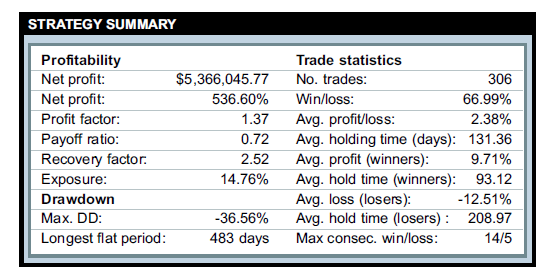
The reversal amount is the distance from the swing high or low used to determine the exit. The exit is constructed by adding (for long trades) the ATR-derived reversal amount to the most recent two-day swing high. For short trades, the reversal amount is subtracted from the most recent two-day swing low. Figure 1 shows the exit typically dangles above the market and, when a trend is in place, continues to move in that direction. When the trend stalls, the exit level follows the market lower and can even reverse direction. The exit has two objectives. The first is to exit trades on strength rather than weakness and benefit from positive slippage. The second is to let winners run as much as possible. The obvious weakness of this exit approach is that it doesn’t offer any loss protection, as illustrated in Figure 2: The exit misses the boat when a trend gives way to volatile, rangebound conditions.
Strategy rules:
1. If yesterday’s close was above the 20-day moving average of closing prices, enter long with a limit order at yesterday’s close minus 1.5 times the 14-day ATR. 2. If yesterday’s close was below the 20-day moving average of closing prices, enter short with a limit order at yesterday’s close plus 1.5 times the 14-day ATR. 3. Exit long position with a limit order at the recent two-day swing high point plus three times the 14-day ATR. 4. Exit short position with a limit order at the recent two-day swing low point minus three times the 14-day ATR
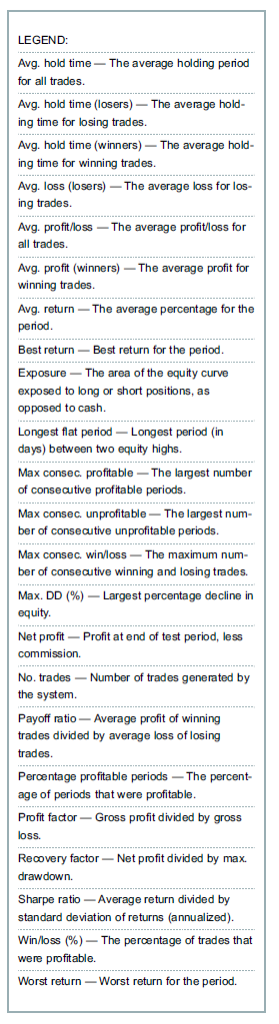
Parameter selection: As a rule, trading system parameters are determined through a portfolio-based optimization on a sample data period. Figure 3 shows the system’s profitability from August 1992 to July 1997 using ATR values (for the exit rule) from 1.0 to 4.0. The majority of values were profitable, except for the 1.0-1.5 range. Three ATRs was selected from the area of stable values. (Note: The “reversal amount” can be customized to the magnitude of trend the trader wishes to trade.) Money management: Risk 1 percent of account equity per position. Starting equity: $1,000,000. Deduct $8 commission and one tick slippage per trade. Test data: The system was tested on the Active Trader Standard Futures Portfolio, which contains the following 20 futures contracts: British pound (BP), soybean oil (BO), corn (C), crude oil (CL), cotton #2 (CT), E-Mini Nasdaq 100 (NQ), E-Mini S&P 500 (ES), 5-year T-note (FV), euro (EC), gold (GC), Japanese yen (JY), coffee (KC), wheat (W), live cattle (LC), lean hogs (LH), natural gas (NG), sugar #11 (SB), silver (SI), Swiss franc (SF), and T-Bonds (US).
Test period: August 1997 to July 2007.
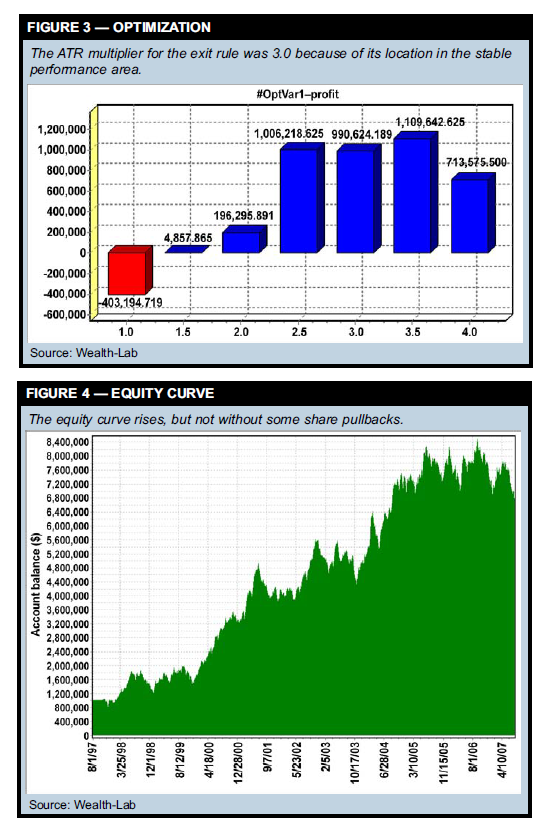
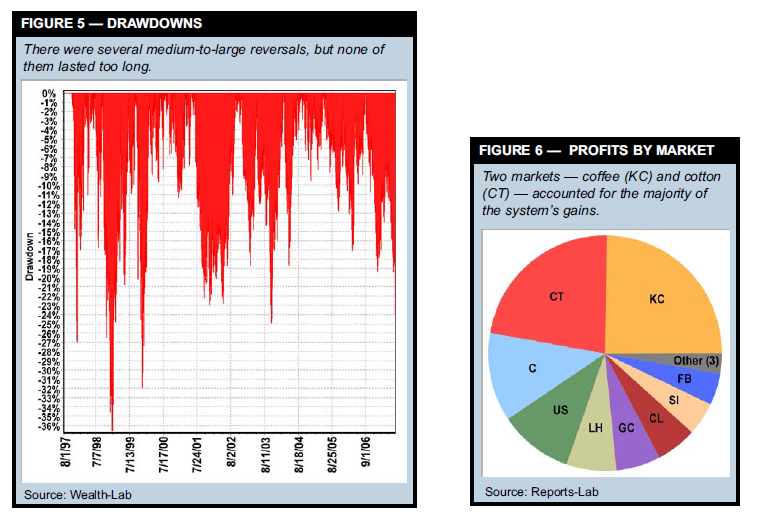
Test results: Testing in the out-of-sample period (August 1997 to July 2007) resulted in a profit of 536 percent — a steady 20.3-percent annualized gain. The equity curve (Figure 4) displays a fairly steady increase until 2005, punctuated by a few drawdowns and pauses. The trade statistics reflect something of a blend of trend-following and countertrend characteristics. The system has a high success rate (67 percent), and the average profit is relatively large (2.4 percent). The system had several drawdowns in excess of 20 percent (two were deeper than 30 percent), but most of them were relatively short-lived (Figure 5). The system’s high exposure is a concern, though. The average holding time for winning trades was 93 days, while losers were held for a whopping 203 days. Both long and short components were profitable, with the short side responsible for more of the system’s gains. Finally, coffee and cotton (Figure 6) accounted for nearly half the system’s gains.
Bottom line: The system’s exit rule is not without its drawbacks — as mentioned, it doesn’t offer protection from trend reversals. Holding positions for so long is not for every trader. A protective stop would be needed to cut losers more effectively. One possible way to cut the time in the market would be to use a factor that would shorten the ATR multiplier with each day a trade is unprofitable. Similarly, watching medium and large profits fade away is quite difficult psychologically, so the reversal amount could be tightened after an outsized profit, as well. The “dangling carrot system” is designed to go for big profits. The exit isn’t a perfect solution, but its rules are simple and adapt to current market conditions.