Japanese candlesticks are the most often used chart type.
Japanese candlesticks first used by Japanese rice traders over 200 years before the first charts appeared in America.
Why do we need them?
- Help to analyze the price movements.
- Define the entry points.
The Japanese candlesticks are very helpful in defining the chart patterns. These patterns can indicate a reversal or the trend continuation. Reversal or continuation of a trend enables the trader to make profit.
How to turn on the candles
1. Switch your chart into Japanese candles (10 seconds for Turbo options, 30 seconds for binary options)
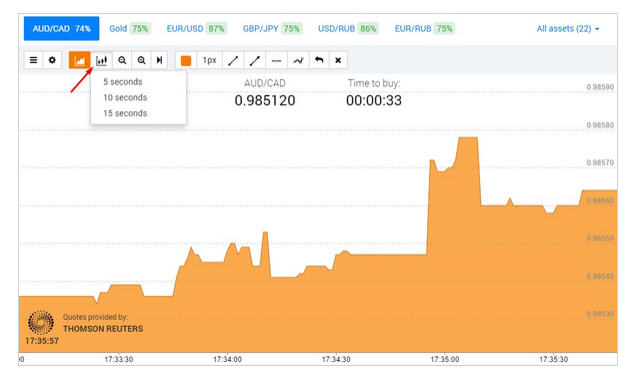
2. The chart will be displayed on your platform, so you can start the analysis.
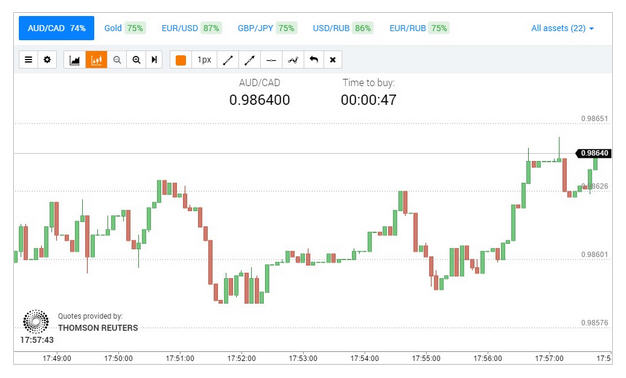
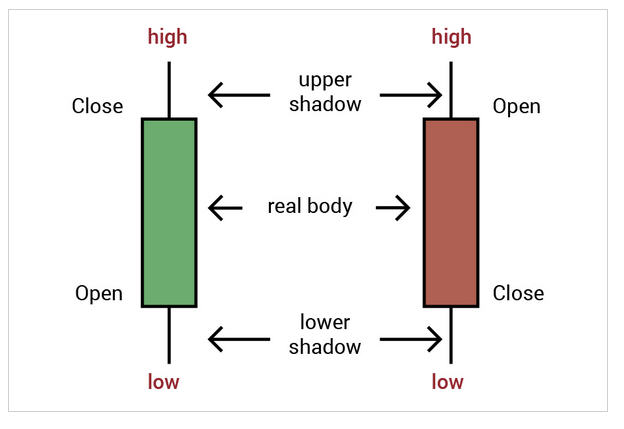
How does it work?
The Japanese candles consist of upper and lower shadows on the ends of the candlestick body. The candle represents an interval between the opening and closing prices. If the market moved up, the candle body is green; if the marked moved down, the candle body is red.
In the candlestick analysis, the trader’s main task is to identify the chart patterns. These patterns can predict reversal or continuation of a trend. If the trader notices that the market situation is changing, he will be able to quickly react and get more profit than those who see the trend in full swing.
There are a few simple strategies based on the candlestick analysis.
By using these strategies, you will be able to predict the trend reversal.
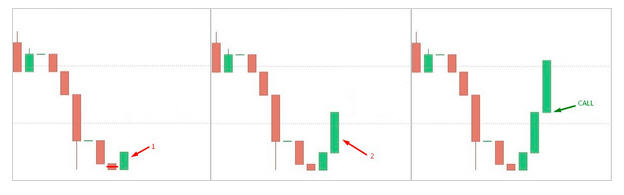
1. Piercing Line Candlestick Pattern (Uptrend)
“The Piercing Line pattern” – trading strategy that helps to determine the upward reversal on the downtrend (consisting of two candles).
Simple layout:
- Find two candles on the chart, one of which closes above the middle of the body of the previous descending candle.
- Wait for the second ascending candle.
- When the third ascending candle appears, buy call option.
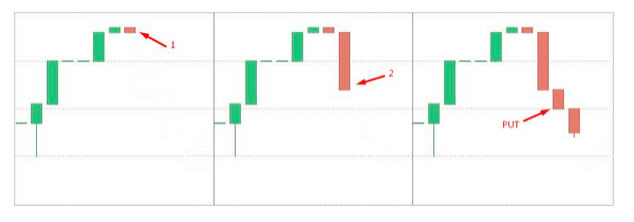
2. Three Black Crows Strategy (Downtrend)
“Three black crows “ – trading strategy aimed at defining the downward reversal on the uptrend (consisting of long descending candles).
Simple layout:
- Find a strong uptrend consisting of several ascending (green) candles in a row;
- Wait for a reversal – three descending (red) candles in a row
- After closing the third candle, buy put option.
Advanced usage
The candlestick patterns are traditionally referred to as “reversal patterns” or “kicker patterns” as they warn about changing trends (not necessarily a reversal), when the trend graduates into a flat or the current movement slows down within one trend. For this reason, when using the candlestick patterns, we should also take into account other indicators like support and resistance levels, resistance, the Moving Averages, etc.
Pin-bar strategy
Pin Bar is a trading strategy which based on very specific chart patterns. This pattern seems like trying to deceive traders, showing false strong movement.
In most cases this pattern is a very strong signal about change in the price movement direction.
Martin Pring in his book “On the pricing model” discussed the formation of candles and bars, and he coined the term «Pinnochio Bar».
Simple work layout:
- Look for “Candle-Pinocchio” which will be a signal to enter the market.
Here is how this figure looks on a chart:
- Look for “Candle-Pinocchio” which will be a signal to enter the market.
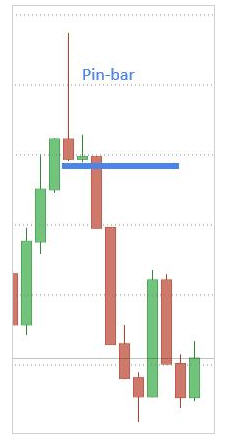
- Define how “good” the Pin-bar is.
Basic properties of a good Pin-bar:
– Pin-bar’s open and close levels need to be placed next to one of the bar ends, that is near either top or bottom.
– Pin-bar’s open and close levels need to be placed within the previous bar, known as the “eye”. - If all the parameters are right, buy option at the moment of pin bar close:
– Pin bar closed down (it was red), buy a put option.
– Pin bar closed up (it was green), buy a call option.
Advanced usage
Pin-bar is used to trade as a separate chart pattern, but the best results are achieved when there are:
- Breaking levels of moving averages;
- Breaking levels of support and resistance;
- The most powerful patterns are drawn in the merger of the above factors
- At the top or at the bottom of the trend.
If Pin-bar is formed under the circumstances listed above, it indicates of high trend changes probability.
As soon as the Pin-bar low is broken going opposite to the nose, it will be the last signal to our confidence that we will earn.