Traders often view the Commitment of Traders (COT) report as a futures market Rosetta Stone — the key to deciphering where different markets are headed. The problem is that the report can confuse as much as it clarifies. Each week, the Commodity Futures Trading Commission (CFTC) publishes the COT report, which lists open interest in more than 90 futures markets — from stock indices, interest rates, and foreign currencies to coffee, corn, and milk (for more details, see “The Commitment of Traders report”). Positions are broken down into categories representing commercial traders (businesses that either use or produce the actual commodities they trade), large speculators (hedge funds, commodity trading advisors, and other money managers), and retail speculators (the “small specs,” or public).
Traders and analysts contend trade signals can be tied to extreme position levels among the different groups. If, for example, large speculators’ net position size (longs – shorts) climbs to a multi-year high, the market could drop, because those long positions will eventually be unwound. (A recent article outlining this type of
contrarian approach in the Russell 2000 index — “Cracking the COT code” — appeared in the July 2007 issue of Futures & Options Trader.) The following discussion uses COT data from the S&P 500 futures (SP) to find an appropriate options trade. Large-speculator net positions in the S&P hit a three-year low in July. In the past seven years, extreme lows in large speculators’ positions have led to significant underlying moves in either direction. Entering a long straddle (long call, long same-strike put) is one way to profit from a large move in the underlying.
What can open interest tell us?
This analysis focuses on large speculators, the COT group consisting of hedge-fund managers, mutual-fund managers, brokerage firms, banks, and other professional managers who hold least 600 contracts in the S&P 500 futures. CFTC reportable levels are 600 contracts or more, a benchmark that defines a large speculator (more than 600 contracts) and a small speculator (less than 600 contracts). As a general rule, if a market’s COT data shows a net short position (less than zero), that market might fall (or consolidate) as traders anticipate a sell-off. Also, if more traders are net long (greater than zero) the sentiment may be bullish. However, this relationship isn’t always accurate, as the following examples demonstrate.
Shifting winds in the S&P 500
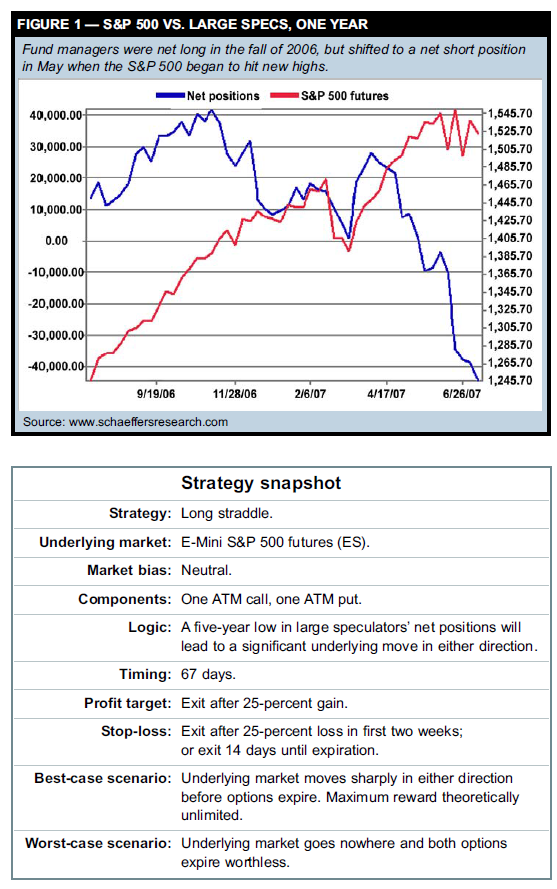
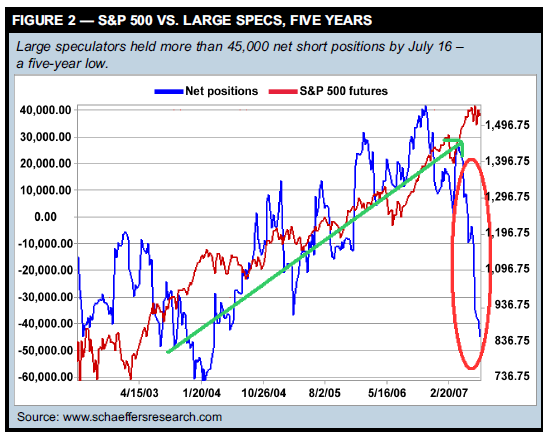
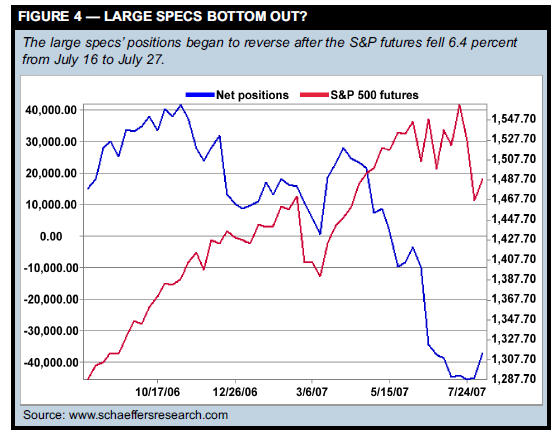
Figure 1 compares the S&P 500 futures (red line) with the net position of large speculators during the past 12 months (blue line). Figure 2 shows the same comparison over the past five years. Large speculators held 40,000 long positions in November 2006 and stayed long until the S&P 500 began to hit new highs this past spring. They shifted to a net short position in May — the first negative reading in more than 12 months — when the S&P 500 futures climbed above 1,520. By July 16, they held more than 45,000 short positions — a three-year low. What was the meaning of this sentiment shift? On the surface, it seems bearish, because demand for equities waned among large specs. However, testing showed the S&P 500 tended to move more than usual — up or down — in the two months after large speculator positions reached yearly lows since 2000.
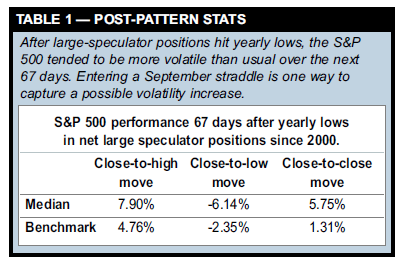
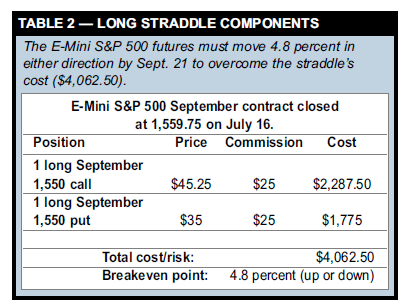
Table 1 shows the S&P 500’s median close-to-high, closeto- low, and close-to-close moves in the two months following yearly lows in smart-money positions. It compares these moves to all same-length moves during the same period (“benchmark”). Although open interest hit annual lows only six times in seven years, Table 1 provides some clues about how the S&P 500 behaves in these situations. Over the next two months, the index climbed 7.90 percent to its high and fell 6.14 percent to its low — at least 1.5 times further than its benchmarks (4.76 and -2.35 percent, respectively). On a close-to-close basis, the S&P 500 gained 5.75 percent, but it tended to fall just as far to its lows. How can you trade this type of “directionless” forecast?
Buying or selling the underlying futures outright isn’t ideal here, but you can enter a long at-the-money (ATM) straddle to exploit a possible large rally or decline. This trade can also benefit from an increase in implied volatility (IV), especially if the market plummets.
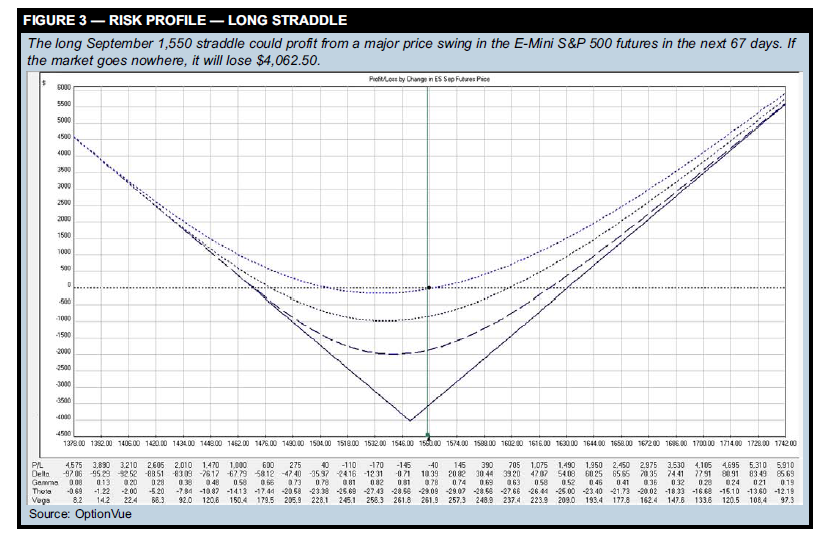
Building a long straddle. A long straddle consists of an ATM call and a put with the same strike. If the underlying market goes nowhere, the options will expire worthless — the strategy’s biggest risk. Ideally, the market will rally or fall enough that one of the options will more than offset the straddle’s cost. On July 16 the S&P 500 cash index closed at 1,542.52 and the E-Mini S&P 500 futures closed at 1,559.75. Let’s assume you bought a 1,550 September call for $45.25 and a same-strike September put for $35.00. In dollar terms, the straddle’s total cost was $4,062.50 (($45.25+ $35) * $50 multiplier + $50 commission). Table 2 lists the long straddle’s details. (Although a 1,550 straddle was not technically ATM on July 16, this strike was chosen instead of the 1,560 ATM strike because the futures market was trading at a 10-point premium to the cash market. By September expiration, however, this premium will erode.) It’s important to choose an expiration month that gives the market ample time to move. Using September options gave the market 67 days to make a sufficiently large move in either direction before expiration. Although an August straddle was cheaper, it had a higher negative theta. And time premium bleeds most rapidly in the last month before expiration. For example, the August 1,550 straddle had a daily theta of -$201; the September 1,550 straddle had a daily theta of -$146, which is much more reasonable. Figure 3 shows the straddle’s potential gains and losses on four dates: the July 16 trade entry (upper dotted line), the Sept. 21 expiration (solid line), and two interim days (middle lines). The goal is to take advantage of a major price swing in the S&P 500 before expiration in 67 days. Possible exit criteria: if the trade gains 25 percent, if it loses that much in the first two weeks, or 14 days prior to options expiration. For the position to profit, the EMini S&P 500 futures must move at least 75 points (4.8 percent) — the quicker the move, the better. This straddle is a high-vega trade, so you are essentially buying volatility. Profits will likely increase if IV climbs. Therefore, if the underlying sells off, this trade will benefit more because volatility will jump.
Related reading Articles by Charlie and Jes Santaularia “Playing defense: Long puts vs. bear put spreads” Futures and Options Trader, June 2007. Protecting a portfolio from a market downturn doesn’t have to be complicated. Find out which defensive strategy offers the most bang for your buck. “Another look at diagonal spreads” Options Trader, March 2007. This position combines bullish and bearish diagonal spreads and is quite flexible if you’re willing to adjust its components. Other articles “Cracking the COT code” Futures and Options Trader, July 2007. Trading the Russell 2000 with data found in the Commitment of Traders report. “Gauging trader commitment” Currency Trader, August 2006. Analyzing the euro with Commitment of Traders data sheds light on the strength or weakness of price moves. “Floyd Upperman: Digging into COT data” Active Trader, February 2006. It’s not just a matter of hedgers vs. speculators. An engineer turned trader discusses ways to make sense of the futures Commitment of Traders report. “Larry Williams looks inside futures” Active Trader, January 2006. Larry Williams discusses the twists he puts on the Commitment of Traders report in his latest book. “Testing the commitment of traders” Active Trader, March 2004. Does knowing how long or short different groups of professional and retail traders are have any value in gauging market direction? This analysis takes a well-known number (Commitment of Traders) and tests it on different markets. “All traders big and small: The Commitment of Traders report” Active Trader, March 2003. In futures, as in stocks, the “institutional” money usually dictates price action. The Commitment of Traders report gives you a glimpse of what the big money is doing in the markets you trade.
The Commitments of Traders report
Published weekly by the Commodity Futures Trading Commission (CFTC), the Commitments of Traders (COT) report breaks down the open interest in major futures markets. Clearing members, futures commission merchants, and foreign brokers are required to report daily the futures and options positions of their customers that are above specific reporting levels set by the CFTC. For each futures contract, report data is divided into three “reporting” categories: commercial, non-commercial, and non-reportable positions. The first two groups are those who hold positions above specific reporting levels. The “commercials” are often referred to as the large hedgers. Commercial hedgers are typically those who actually deal in the cash market (e.g., grain merchants and oil companies, who either produce or consume the underlying commodity) and can have access to supply and demand information other market players do not. Non-commercial large traders include large speculators (“large specs”) such as commodity trading advisors (CTAs) and hedge funds. This group consists mostly of institutional and quasi-institutional money managers who do not deal in the underlying cash markets, but speculate in futures on a large-scale basis for their clients. The final COT category is called the non-reportable position category — otherwise known as small traders — i.e., the general public.
Managing the trade
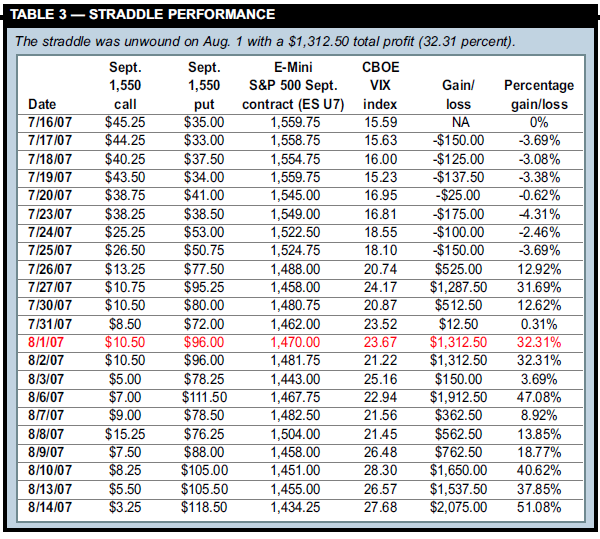
A long straddle is a passive strategy. After you place it, no adjustments are necessary — just wait until the underlying moves. Table 3 lists the daily closing prices of the EMini S&P 500 September contract and the CBOE volatility index (VIX) along with the straddle’s daily gains and losses. In the first week, the market fell 0.95 percent, and the straddle was basically flat. Remember it doesn’t matter whether the market is bullish or bearish, as long as it moves more than 4.8 percent. After a few weeks of volatile trading, the market began to sell off more dramatically. By July 27 it had fallen 6.4 percent to 1,458 and the VIX had jumped 55 percent to 24.17, which increased the straddle’s profitability. At this point, the trade had gained 32 percent, surpassing its profit target of 25 percent. You could exit at this point or place stops to protect your gains. Figure 4 shows the large specs’ net positions began to reverse after the S&P futures fell sharply in late July. The straddle was unwound on Aug. 1 when the E-Mini S&P 500 closed at 1,470 and the VIX closed at 23.67. The final profit was 31.07 percent (($-34.75 call loss + $61 put gain) * $50 multiplier + $50 commission = $1,262.50). The market dropped 5.7 percent, and the VIX climbed 51.8 percent during the trade’s lifetime. Table 3 also shows potential profits if you had held the position for a few more days. The straddle would have benefited from further market weakness and a rising VIX. However, holding the straddle after such a sharp decline is risky; the straddle’s profits will deteriorate if a sharp bounce-back occurs.
Taking a long view
One way to find tradable ideas in COT reports is to spot longer-term shifts in sentiment and then create strategies based on these changes. But all futures markets are different, which means you can’t assume a successful COTbased strategy in one market can be applied to another