The long straddle is a non-directional option
strategy that can yield solid results with low
risk. It’s used when you expect a stock or
futures contract to make a big price move but
you don’t know whether it will be up or down.
Besides price, the other variables that affect the value of a
long straddle are volatility and time. A straddle’s value is
very sensitive to changes in implied volatility (IV). Also,
because a straddle consists of long options, its value erodes
a little bit each day (the process known as “time decay”).
After explaining how to construct a long straddle, we’ll
examine how to take into account the current volatility situation
and the effects of time decay when planning a trade.
Finally, we’ll compare two straddles that use options from
different expiration months to illustrate how buying more
time can create a trade with a higher probability of success.
Constructing a long straddle
A long straddle is created by purchasing equal numbers of
call and put options on the same underlying instrument
and with the same strike price and expiration month. It
makes sense to buy near-the-money options so a sharp
price move has a better chance of increasing the position’s
value. A large price move will make one of the legs deep in
the money, providing a gain by virtue of price movement
alone.
Also, an at-the-money straddle will be cheaper than a
straddle whose strike price is not equal to the stock price
because it consists of options whose values are composed
solely of time value (i.e., neither option has any intrinsic
value). Of course, you will not always find strike prices that
are identical to the current stock price, but you want
options that are as close as possible.
Buying undervalued options helps put the odds further in
your favor. The trick is to determine when options are
cheap. Options are undervalued when IV is low from a historical
perspective (that is, it is low compared to past IV
readings), as well as low relative to historical, or statistical
volatility (SV), which is the actual volatility of the stock.
Also, another reason to buy at-the-money options is changes
in IV will have a bigger impact on them with a few months
left to expiration.
Long straddles actually provide two ways to make money:
Either the underlying stock can make a big price move, or IV
can increase. Because volatility changes have such a big
impact on a straddle’s value, the next issue we will investigate
is how to find straddle candidates with historically low
IV levels, and how to measure the effect an IV increase has
on an option’s value.
Putting volatility in your corner
Placing a long straddle on a stock with historically low IV
can provide a considerable advantage. Every asset has quiet
periods when its options are cheap and volatile periods
when its options are expensive. You should also be aware
volatility has an important tendency called “reversion to
the mean.” After reaching extreme highs or lows, volatility
tends to return to a more “normal,” average level.
The first thing to look for when searching for likely straddle
candidates is the current IV compared to past IV. The
best candidates for long straddles are in the 10th percentile
of cheapness — that is, 90 percent of the time the IV has
been higher than it is currently. This increases the odds IV
will revert to a higher level, increasing the straddle’s value.
Different time periods can be used to calculate this percentile;
the past three years of volatility history is a good
place to start.
One way to measure IV in this way is to average the IV
levels of both calls and puts and then plot those averages on
a graph, with each data point representing a weekly average.
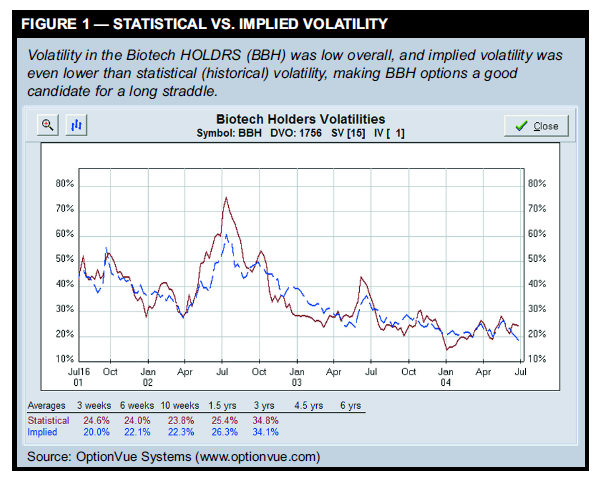
Figure 1 shows an example of a volatility chart for the
Biotech HOLDRS (BBH) that showed up as a likely straddle
candidate, which in early July had IV in the 1-percentile rank, meaning IV at this time was
lower than 99 percent of IV readings
over the past six years.
The volatility chart has two lines.
The solid line is statistical volatility
(SV), which shows the actual volatility
of the stock’s daily price changes. The
dashed line is the average IV, the
volatility implied by BBH option
prices. Not only was IV currently at its
lowest point since options began trading
on BBH, but it was also considerably
lower than SV (15 percentile
rank), indicating the option prices are
not even reflecting the actual volatility
of the stock.
Aposition’s sensitivity to changes in
IV is measured by vega, which is one of
the option “Greeks.” For ease of use,
vega is usually shown as the gain or loss a position would
experience because of a 1-percent IV increase. Long straddles
always have positive vega, which is why they are popular
for exploiting expected increases in IV. A long straddle’s
vega is highest when the stock price is identical to the options’ strike price.
The drawback of time
Options are a decaying asset, and as you get closer to expiration,
the rate of decay accelerates. The value of a straddle’s
long calls and puts constantly declines because of time
decay. As a result, to make a reasonable profit you need a
price move and/or an IV increase that can overcome the
time decay plus the initial purchase cost.
Theta is used to measure a position’s sensitivity to the
passing of time. It is usually expressed as the value a position
would lose in one day due to the effect of time alone.
Theta is always negative for a long straddle because the
options lose value as time passes.
Time decay doesn’t manifest itself immediately. A sixmonth
straddle does not decay much at first, and time
decay does not really begin to accelerate until the last
month or so before expiration.
Because volatility trades take time to develop, make sure
you give yourself enough time for IV to make the move you
expect. Look to use farther-out options, even LEAPS (Long-
Term Equity AnticiPation Securities, which are options that
can expire several years in the future), when buying straddles
to provide plenty of time for IV to revert to its average
level.
Choosing the best position
Many traders have difficulty understanding exactly how
option spreads become profitable. For a long straddle to be
profitable at expiration, the stock price must be sufficiently
higher or lower than the options’ strike price to give either
the call or put enough intrinsic value to offset the straddle’s
original cost. But before expiration, you must take into
account the simultaneous effect changes in the underlying
stock price, implied volatility, and time have on each leg of
the spread. For that reason, having access to a program that
allows you to analyze and graphically display the profit or
loss of a potential option trade is very important.
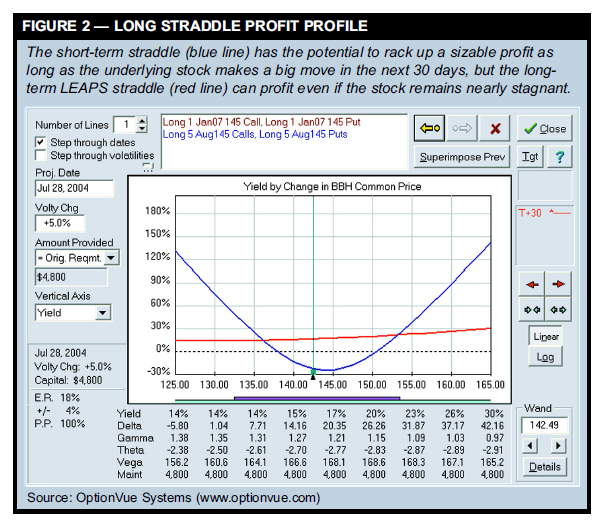
Let’s compare how profitable two long straddles in the
Biotech HOLDRS might be, one using the August 2004
options (with 54 days to expiration), and the other using the
January 2007 LEAPS (more than two years to expiration). In
early July, BBH was trading at 142.5, exactly halfway
between the available strike prices of 140 and 145.
Comparing the possible trades revealed using the 145 strike
price had a higher expected return.
The following trade examples used $5,000 as the maximum
amount of capital to invest, in each case buying as
many contracts as possible to keep the amount invested in
the trades as close as possible.
The shorter-term straddle position is:
Buy five August 145 calls (BBHHI) at $3.40 ($1,700)
Buy five August 145 puts (BBHTI) at $5.30 ($2,650)
Total cost: $4,350
The longest-term LEAPS straddle is:
Buy one January 2007 145 call (OEEAI) at $28.10 ($2,810)
Buy one January 2007 145 put (OEEMI) at $19.90 ($1,990)
Total cost: $4,800 The straddle using the August
options has a vega of 215.2 and a
theta of -37.5 when it is placed. The
vega/theta ratio is 5.7, which means
IV must rise 1 percent in only 5.7
days just for the position to remain
at breakeven. The straddle using the
January 2007 LEAPS has a 139.9
vega and a -2.92 theta, which translates
to a 47.9 vega/theta ratio,
which means IV only needs to
increase 1 percent every 47.9 days
for the position to stay even. Of
course, any price moves by the stock
would also affect the positions’ values.
Figure 2 shows what the two
trades would look like 30 days from
purchase with a projected IV
increase of 5 percent during this
time. It’s clear if you want to swing
for the fences and hope a large price
move occurs relatively quickly, you should use the shorterterm
options because you actually have the chance,
although small, of doubling your money in a short time
period. However, just to break even in 30 days — even with
a 5-percent IV increase helping out — the stock would have
to move down to $137.80 or up to $150.60. In other words,
to do better than the LEAPS straddle, BBH would have to
drop at least $6.19 or increase $10.51 in the next 30 days.
In contrast, notice the longer-term LEAPS straddle would
be profitable across the range of stock prices as long as IV
increased 5 percent. In fact, if the stock bounced around but
ended up right where it started at $142.50, you would still
make a 15-percent return (177 percent annualized), compared
to a 30-percent loss using the shorter-term options.
That shows just how important buying time can be in determining
your probability of placing a successful trade.
Deciding when to close a long straddle is subjective. If a
move in the underlying stock has created a gain, one leg
will now be worth much more than the other. The dominant
leg will then be much more sensitive to changes in the
underlying stock price. You should then determine if
volatility has returned to more normal levels, and consider
closing the position if it has.
Buying fairly valued options isn’t a bad thing
The argument many traders make against buying options is
time decay is against you, but there is nothing wrong with
buying an option that is fairly valued. Despite the drawback
of time decay, the underlying market is in constant motion.
In fact, time is precisely what gives the underlying stock or
future its freedom to move. You simply need to evaluate
whether the underlying instrument can move enough to
make a long straddle profitable.
Identifying stocks with inexpensive options puts the
odds further in your favor. Volatility traders often create
positions using short-term options, expecting volatility to
revert quickly to its mean. However, experience suggests
that’s a difficult expectation to meet. It can happen, but
cheap options often stay cheap for quite a while. When buying
long straddles, it’s a good idea to consider using the
longest-dated options available with decent liquidity.
Keep in mind the value of a straddle with more days until
expiration will not change as much as one with fewer days
left when the stock price moves up or down. The best straddle
for taking advantage of changes in IV is not going to be
the best one to capitalize on quick moves in the stock price.
Creating positions you’re comfortable with and understanding
how to balance likely price moves against theta
and vega are things you need to consider when trading
straddles. There are no sure things in option trading, but
understanding how a straddle works allows you to put the
odds in your favor when using this strategy
Call buying opportunities
Market: Options on the Dow Jones Industrial
Average (DJX).
System concept: This options lab tests the
profitability of a technical pattern first identified
in the January issue of Active Trader
(“Hitting bottom,” p. 12). The pattern tries to
spot market bottoms in the Dow Jones
Industrial Average (DJIA), so the strategy
involves buying call options to take advantage
of an expected rebound.
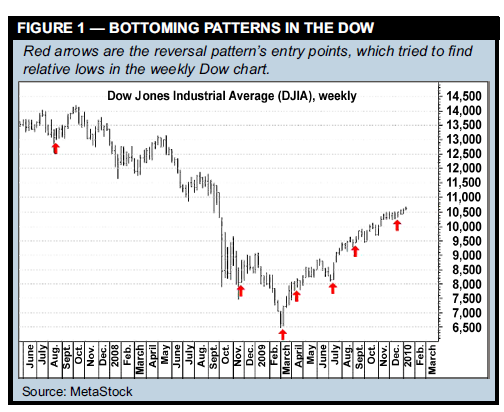
The two-week pattern forms as the
Dow bottoms out. In the first week, the
market opens near the top of its range
before losing ground, and it reverses
direction in the second week.
Historical testing shows the Dow rose
sharply (and consistently) over the
next 12 weeks, suggesting it managed
to pinpoint some relative lows.
The formula for entry signals is:
1. (Open[2]-Low[2])/(High[2]-Low[2])
> .75
2. High[1]>High[2]
3. Low[1]>Low[2]
4. Close[1]>Close[2]
5. (Close[1]-Low[1])/(High[1]-Low[1])
> .75
Where: [0], [1], [2], refer to this week,
last week, and two weeks ago.
The pattern finds that weeks that
start strong and sometimes lose steam
are followed by weeks that bounce back and close even
stronger. Figure 1 shows this system’s bullish entry points
in the Dow since June 2007.
The trade rules simply buy 10 at-the-money (ATM) calls.
Because the pattern is based on a weekly chart and waits 12
weeks for the market to rebound, the strategy buys calls in
the first option expiration month with at least 90 days
remaining.
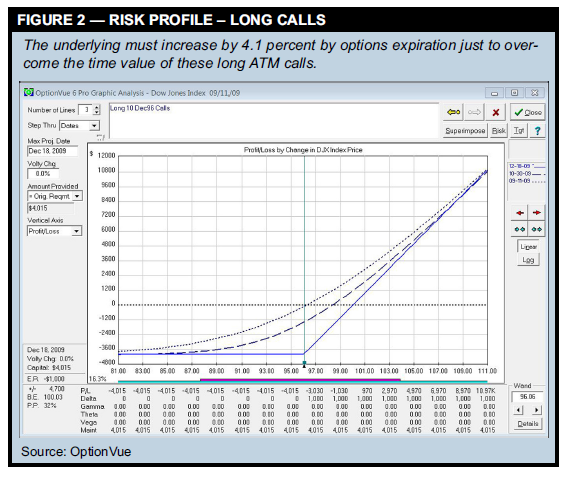
Figure 2 shows the potential gains and losses of a long
call entered on Sept. 11, 2009 when DJX was at 96.06 and
held through Dec. 18, 2009. The position of 10 long
December 96 calls cost $4,015 and would break even only if
the market climbed to 100.03 by expiration. If DJX finishes
below 96, the calls will expire worthless and lose their entire
cost ($4,015). Clearly, the underlying market needs gain
ground to overcome this time decay.
Trade rules:
1. When signal triggers on
Friday’s close:
2. Buy 10 ATM calls in first
month with at least 90 days
remaining before expiration.
Exit at expiration by letting the
calls expire worthless or
exercise into cash.
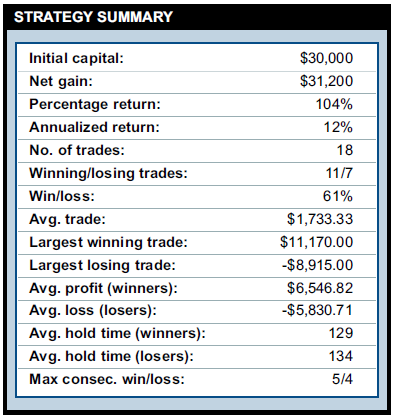
Starting capital: $30,000.
Execution: Option trades were
executed at the average of the bid
and ask prices at the daily close, if
available; otherwise, theoretical
prices were used. Commissions were $15 per trade.
Test data: The system was tested on cash-settled Dow
Jones index (DJX) options.
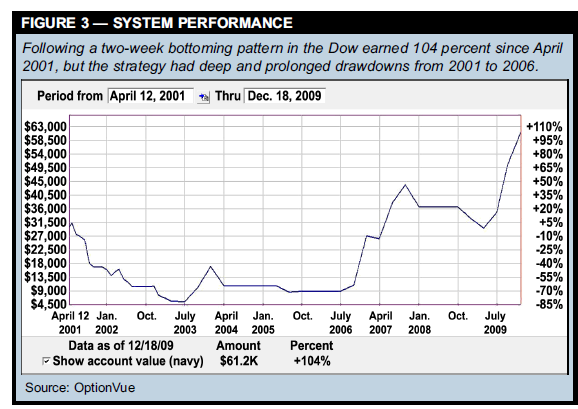
Test period: April 12, 2001 to Dec. 18, 2009.
Test results: Figure 3 shows strategy gained $31,200 (104
percent) since April 2001, an annualized return of 12 percent.
The strategy’s average losing trade (-$5,830.71) was
less than its average winning trade ($6,546.82), but a losing
streak can quickly deplete your capital. The first four trades
in 2001 all lost money, and the drawdown grew to $24,510.
Overall, the system traded 18 times in eight and a half
years, 61 percent of which were profitable. Statistically,
ATM long calls have a probability of winning about 33 percent
of the time, so the system has a definite trading edge.
Note: The total number of trades (18) is a relatively small
number to base conclusions on. It would
require a great deal of courage to actually
trade such a volatile system.